Image Details

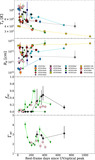
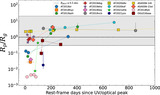
Caption: Figure 9.
X-ray luminosity (L X) as a function of peak temperature (T p ). The upper panel shows sources where an L X∝﹩{T}_{p}^{\alpha }﹩ relation is observed, with the best-fit α for each source shown in the legend. The bottom panel shows the source where a clear decoupling between L X and T p is present. The color of the markers maps the L BB/L X ratio between the UV/optical luminosity and the L X following the color bar on the right side of the figure.
Other Images in This Article

Show More
Copyright and Terms & Conditions
© 2024. The Author(s). Published by the American Astronomical Society.