Image Details
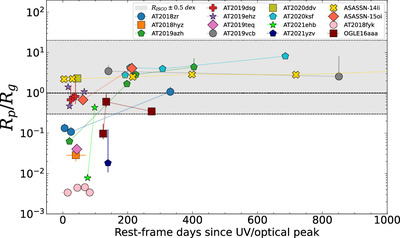
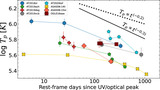
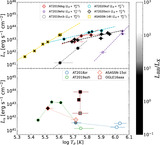
Caption: Figure 10.
Apparent radius (R p ) of the peak temperature normalized by the gravitational radius (R g ) as a function of days since the UV/optical peak. Only sources with no corona emission (see Section 4.3) are shown. The gray shaded region shows the 0.3 ≤ R p /R g ≤ 20 interval in which the measured R p /R g is statistically consistent with R ISCO.
Other Images in This Article

Show More
Copyright and Terms & Conditions
© 2024. The Author(s). Published by the American Astronomical Society.