Image Details
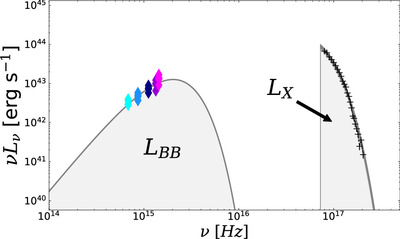
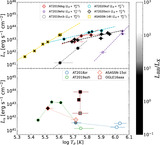
Caption: Figure 3.
Illustration of how the UV/optical blackbody luminosity (L BB) and the 0.3–10 keV X-ray luminosity (L X) are measured and what those values represent regarding the full SED of the transient. Colored points indicate observed UV/optical photometry, the best-fitting blackbody function is shown in dark gray, and the area below the curve is the measured L BB. The black plus signs show the observed X-ray spectra and best-fit X-ray model, and the measured L X is also shown in gray. Both UV/optical and X-ray components are corrected for Galactic extinction/absorption.
Other Images in This Article
Show More
Copyright and Terms & Conditions
© 2024. The Author(s). Published by the American Astronomical Society.