Image Details
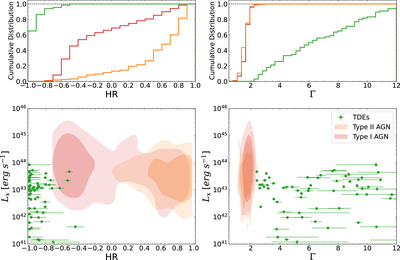
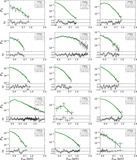
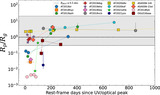
Caption: Figure 4.
Comparison between X-ray spectral properties of TDEs (green) and AGN (type I in red and type II in gold) from BASS (Ricci et al. 2017). In the left panels, we compare the Swift/XRT or XMM-Newton HR (see text for definition); in the right panels, we compare the Γ power-law index when TDEs are fitted with an absorbed power-law model. The top panels show the cumulative distribution of the parameters, while the bottom panels show the distribution of samples in the L X vs. HR and L X vs. Γ parameter space. For AGNs, the contours represent 68% and 90% of the sample distribution; for TDEs, each point is an XMM-Newton or Swift/XRT stacked spectrum.
Other Images in This Article

Show More
Copyright and Terms & Conditions
© 2024. The Author(s). Published by the American Astronomical Society.