Image Details
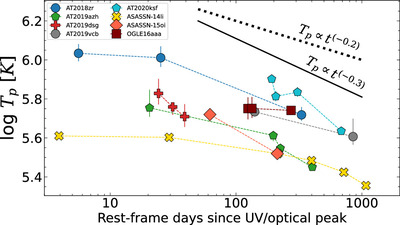
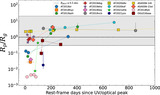
Caption: Figure 8.
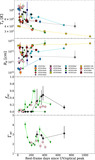
Peak temperature (T p ) of the accretion disk model as a function of days since the UV/optical peak. Only sources with at least two fittable spectra and with no corona emission (see Section 4.3) are shown. The solid black line shows the expected theoretical evolution for a finite stress at the ISCO.
Other Images in This Article

Show More
Copyright and Terms & Conditions
© 2024. The Author(s). Published by the American Astronomical Society.
Copyright ©
2026 Astronomy Image Explorer. All Rights Reserved.