Image Details
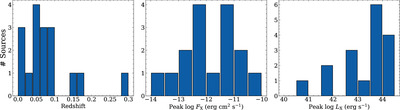
Caption: Figure 1.
Histogram of the distributions of the properties of our main sample. Redshift (z; left), neutral absorption-corrected peak 0.3–10 keV X-ray flux (F X; middle), and neutral absorption-corrected peak 0.3–10 keV X-ray luminosity (L X; right).
Other Images in This Article

Show More
Copyright and Terms & Conditions
© 2024. The Author(s). Published by the American Astronomical Society.
Copyright ©
2026 Astronomy Image Explorer. All Rights Reserved.