Image Details
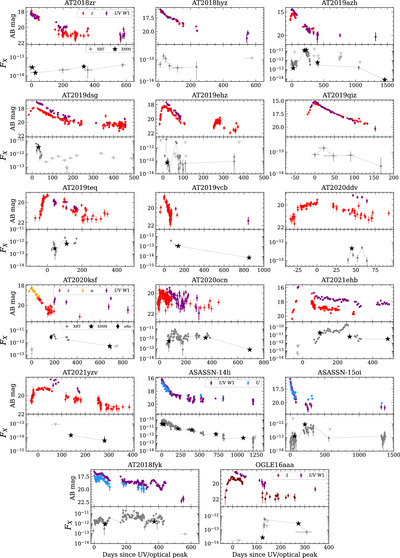
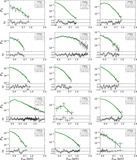
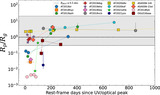
Caption: Figure 2.
UV/optical (top panels) and X-ray (bottom panels) light curves from our sample of 17 optically selected X-ray-detected TDEs. In the top panels, we show the ZTF r band (red points), Swift/UVOT UV W1 band (purple points), ATLAS o band (orange points), and OGLE I band (maroon points), all in magnitudes in the AB system. In the bottom panels, we show the neutral absorption-corrected 0.3–10 keV X-ray flux (F X) for Swift/XRT in gray points, XMM-Newton in stars, and SRG/eROSITA in diamonds.
Other Images in This Article

Show More
Copyright and Terms & Conditions
© 2024. The Author(s). Published by the American Astronomical Society.
Copyright ©
2026 Astronomy Image Explorer. All Rights Reserved.