Image Details
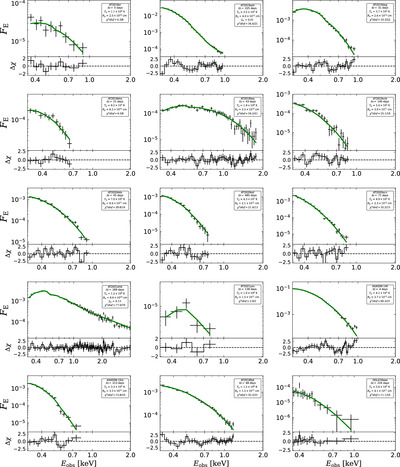
Caption: Figure 6.
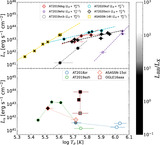
Representative unfolded spectra, best-fit model, and residuals for all the sources with available XMM-Newton data in our sample. Top panels show the unfolded spectra in black and the best-fitting model in green (either tdediscspec or simPL⨂tdediscspec) in units of keV cm−2 s−1 keV−1. Bottom panels show the residuals in Δχ.
Other Images in This Article

Show More
Copyright and Terms & Conditions
© 2024. The Author(s). Published by the American Astronomical Society.
Copyright ©
2026 Astronomy Image Explorer. All Rights Reserved.