Image Details
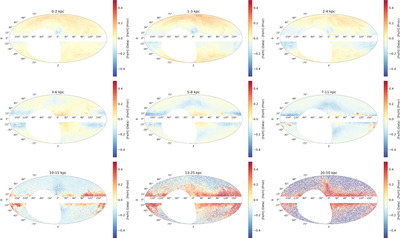
Caption: Figure 14.
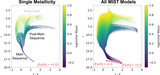
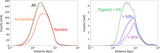
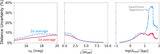
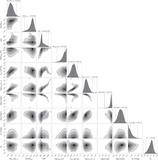
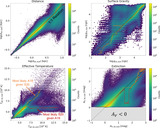
As Figure 13, but now showing the difference between the mean [Fe/H]init from the data and the prior. Deviations can be seen in all distance bins, although the size of the deviations increases as a function of distance. Clear systematics in the [Fe/H]init estimation aligned with foreground dust extinction features and objects near the Galactic plane are visible. We see evidence for lower-than-expected [Fe/H]init values (compared to the prior) for stars in the Monoceros Ring and higher-than-expected [Fe/H]init values for stars in the Sagittarius Stream. An interactive version of this figure is available in the article and also at https://faun.rc.fas.harvard.edu/czucker/Paper_Figures/brutus_multipanel_toggle.html. An interactive version of Figures 11–14 is available. In this interactive version, the projected sky coverage maps are shown at the top while histograms highlighting wavelength coverage are shown at the bottom. Buttons at the top middle allow the user the ability to see how the coverage changes when including/excluding data from Pan-STARRS1, 2MASS, UKIDSS, and unWISE. Buttons at the top right provide pan, zoom, save, and reset functionality; hover the mouse over each button to see what it does. An interactive version of this figure is available.
An interactive version of this figure is available in the online journal.
Other Images in This Article
Show More
Copyright and Terms & Conditions
© 2024. The Author(s). Published by the American Astronomical Society.