Image Details
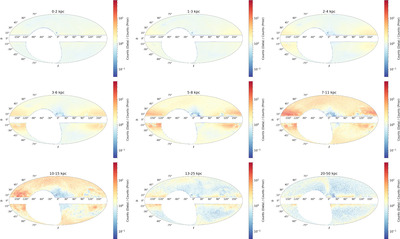
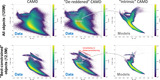
Caption: Figure 13.
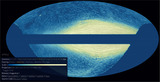
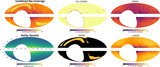
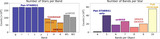
As Figure 11, but now showing the ratio between the data and the prior. This highlights deviations from the assumed Galactic model (i.e., “the background”) in order to emphasize substructure present in the data. The Monoceros Ring in the Galactic anticenter can be clearly seen as a ≳10 times overdensity relative to the background from d ∼ 5–15 kpc. We also observe broad flaring in the disk, which is not modeled in our prior. At d > 20 kpc, the Sagittarius Stream is also clearly visible, with number densities also ≳10 times higher than the background. An interactive version of this figure is available in the article and also at https://faun.rc.fas.harvard.edu/czucker/Paper_Figures/brutus_multipanel_toggle.html. An interactive version of Figures 11–14 is available. In this interactive version, the projected sky coverage maps are shown at the top while histograms highlighting wavelength coverage are shown at the bottom. Buttons at the top middle allow the user the ability to see how the coverage changes when including/excluding data from Pan-STARRS1, 2MASS, UKIDSS, and unWISE. Buttons at the top right provide pan, zoom, save, and reset functionality; hover the mouse over each button to see what it does. An interactive version of this figure is available.
An interactive version of this figure is available in the online journal.
Other Images in This Article
Show More
Copyright and Terms & Conditions
© 2024. The Author(s). Published by the American Astronomical Society.