Image Details

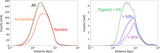
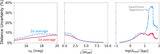
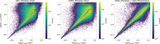
Caption: Figure 4.
CMDs for the MIST models used in this work as a function of Pan-STARRS i-band magnitude at d = 1 kpc and Pan-STARRS r − z color. The left panel shows the models used with [Fe/H]init= +0.02, with the rough locations of the main-sequence and post-main-sequence evolutionary phases indicated. The underlying mass tracks are shown as light gray lines, with the actual models used shown as points and colored by logMinit. The right panel shows the entire collection ∼750,000 models defined over [Fe/H]init= −4.0 to +0.5 that are used in this work.
Other Images in This Article
Show More
Copyright and Terms & Conditions
© 2024. The Author(s). Published by the American Astronomical Society.
Copyright ©
2025 Astronomy Image Explorer. All Rights Reserved.