Image Details
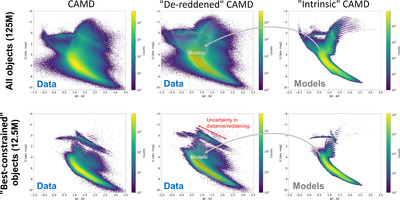
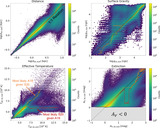
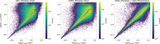
Caption: Figure 8.
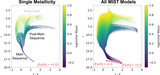
The Gaia G vs. BP − RP color–absolute magnitude diagram (CAMD) for all sources in Augustus-Gold (125 million objects; top) and “best-constrained” sources (12.5 million objects; bottom) which have 10 bands of Pan-STARRS, 2MASS, UKIDSS, and/or unWISE photometry and 95% distance credible intervals that are <30% of the median distance (i.e., ∣(d 97.5 − d 2.5)/d 50∣ < 0.3). The left panels show the CAMD after shifting sources to d = 10 pc using a random sample drawn from the stellar posterior. The middle panels shows the “dereddened” CAMD using the A V and R V values from the same random posterior sample and the predicted linear reddening vector from the stellar parameters associated with them. The right panels show the predicted CAMD computed directly from the models; this is also overplotted as the light gray shaded region in the middle panel for ease of comparison. As the Gaia photometry was not used when deriving the stellar posteriors but whose wavelength coverage overlaps with the Pan-STARRS data, this serves as a useful but limited check on the internal self-consistency and overall quality of the results. We find excellent overall agreement between the intrinsic CAMD predicted by the models and the “empirical” CAMD derived from the data, with uncertainties mostly scattered in the direction of the reddening vector. Some exceptions to this include noticeable gridding effects in evolved stellar evolutionary phases (thin overdense regions), issues modeling the horizontal giant branch (upper left regions), and dwarf/giant misclassification (middle right regions).
Other Images in This Article
Show More
Copyright and Terms & Conditions
© 2024. The Author(s). Published by the American Astronomical Society.