Image Details
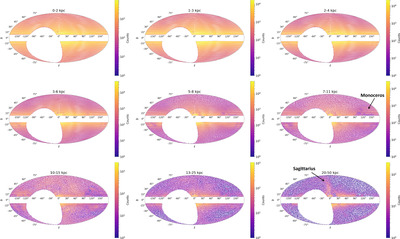
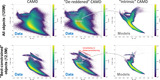
Caption: Figure 11.
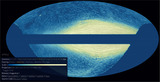
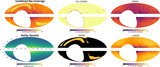
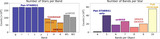
The mean number density of stars in (overlapping) distance bins ranging from d = 0–50 kpc at a healpix resolution of nside = 64 (see Figure 2). The bulk motion of stars within each healpix pixel (corrected for solar reflex motion) are indicated by small arrows and estimated using the mean proper motion. We can see clear evidence of large-scale features in our maps, including evidence of the Sagittarius Stream (bottom right) and the Monoceros Ring (middle right) along with “missing regions” where substantial foreground dust extinction removes stars from our catalog. An interactive version of this figure is available in the article and also at https://faun.rc.fas.harvard.edu/czucker/Paper_Figures/brutus_multipanel_toggle.html. An interactive version of Figures 11–14 is available. In this interactive version, the projected sky coverage maps are shown at the top while histograms highlighting wavelength coverage are shown at the bottom. Buttons at the top middle allow the user the ability to see how the coverage changes when including/excluding data from Pan-STARRS1, 2MASS, UKIDSS, and unWISE. Buttons at the top right provide pan, zoom, save, and reset functionality; hover the mouse over each button to see what it does. An interactive version of this figure is available.
An interactive version of this figure is available in the online journal.
Other Images in This Article
Show More
Copyright and Terms & Conditions
© 2024. The Author(s). Published by the American Astronomical Society.