Image Details
Caption: Figure 3.
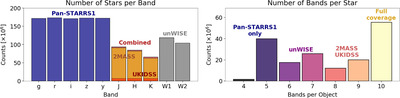
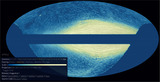
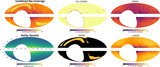
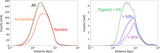
Histograms illustrating the wavelength coverage of the data used in this work that serves to complement Figure 2. The left panel shows the number of stars available in each band, color coded by survey, illustrating the uniform Pan-STARRS selection and amount of NIR and IR coverage available through 2MASS and unWISE, respectively. Compared with Figure 2, we can see that although the UKIDSS data are quite deep, the total amount of objects with UKIDSS photometry is quite small due to its high-latitude targeting. We also see that a substantial amount of objects are detected in the unWISE catalog. The right panel shows the number of bands per star, highlighting that the majority of the sample has full coverage across all 10 possible bands. Regions where we roughly lose coverage across various surveys are labeled, with the next largest peak of objects having only ∼5 bands of coverage (mostly in the optical) closer to the Galactic plane. An interactive version of this figure is available in the article and also at https://faun.rc.fas.harvard.edu/czucker/Paper_Figures/brutus_sky_coverage.html. An interactive version of Figures 2 and 3 is available. In this interactive version, the projected sky coverage maps are shown at the top while histograms highlighting wavelength coverage are shown at the bottom. Buttons at the top middle allow the user the ability to see how the coverage changes when including/excluding data from Pan-STARRS1, 2MASS, UKIDSS, and unWISE. Buttons at the top right provide pan, zoom, save, and reset functionality; hover the mouse over each button to see what it does. An interactive version of this figure is available. An interactive version of this figure is available.
An interactive version of this figure is available in the online journal.
Other Images in This Article
Show More
Copyright and Terms & Conditions
© 2024. The Author(s). Published by the American Astronomical Society.