Image Details
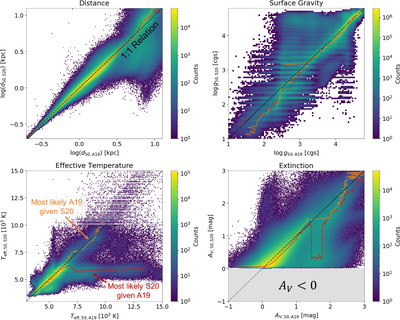
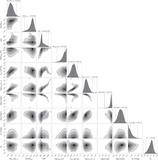
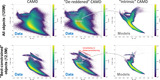
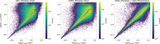
Caption: Figure 9.
Comparisons between the median distance (top left), ﹩\mathrm{log}g﹩ (top right), T eff (bottom left), and A V (bottom right) in this work (Augustus-Gold; “S20”) and A19 for 26 million sources present in both catalogs. In each panel, the most common (i.e., likely) associated value in Augustus-Gold given a value from A19 (i.e., y given x) is shown as a solid red line, and the most common associated value from A19 given Augustus-Gold (i.e., x given y) is shown as a solid orange line. The 1:1 relationship is also overplotted as a dashed black curve. We see that the estimated distances from both catalogs are extremely consistent with each other across most distances, although this work generally prefers source below a few kiloparsecs to be slightly closer. The ﹩\mathrm{log}g﹩ values are also consistent with each other (outside of gridding effects), although there is a clear excess of sources that are classified as low-mass dwarfs in Augustus-Gold relative to A19. The reason for this discrepancy can be seen when examining the estimated T eff, which shows that while the values are consistent across both data sets below T eff ≲ 6000 K, A19 prefer to make sources substantially hotter than Augustus-Gold for T eff ≳ 6000 K. This leads to a corresponding increase in the number of sources with A V ≳ 1 mag, where the higher reddening combined with the intrinsically bluer (hotter) colors end up giving similar SEDs as intrinsically redder (cooler) sources with less reddening. Note that the naming convention “S20” is based on the fact that the original analysis was included in the lead author’s PhD Thesis, which was accepted in 2020 and can be found online at https://nrs.harvard.edu/URN-3:HUL.INSTREPOS:37365889.
Other Images in This Article
Show More
Copyright and Terms & Conditions
© 2024. The Author(s). Published by the American Astronomical Society.