Image Details
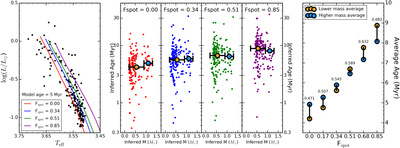
Caption: Figure 7.
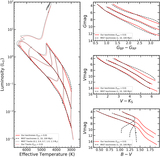
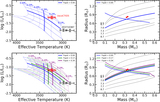
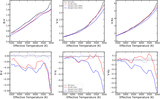
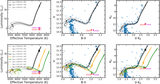
Testing of the influence of starspots on the derived masses and ages of pre-MS stars. Left: H-R diagram including stars from the Upper Sco association. Also plotted are 5 Myr isochrones for four different starspot covering fractions, from 0.00 to 0.85. Center: the masses and ages derived for each Upper Sco star from models with different starspot fractions. The yellow and cyan circles reflect the average age above and below 0.9 M⊙. Right: the average age of the higher and lower-mass ranges for every fspot value in the SPOTS models. At fspot = 0, the higher-mass stars have older measured ages. As fspot increases, the average derived ages increase both for higher and lower masses, but the lower-mass average overtakes and surpasses the higher-mass average. The numbers above each pair of points is the average derived mass of all Upper Sco stars, demonstrating that this metric also increases with increasing fspot.
Other Images in This Article
Copyright and Terms & Conditions
© 2020. The American Astronomical Society. All rights reserved.