Image Details
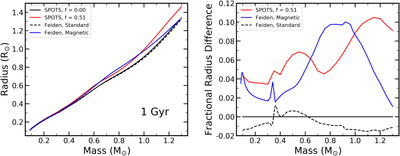
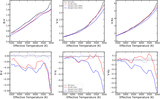
Caption: Figure 5.
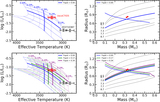
Comparison between the SPOTS models and Feiden models at 1 Gyr. Left: the mass–radius relation of non-magnetic and magnetic versions of both SPOTS and Feiden models. Right: same as the left, but detrended against the fspot = 0.00 SPOTS model. Both magnetic models predict inflation rates of 3%–10%, but the morphology of the mass-dependent inflation percentage differs. Their similarity is encouraging, given the many different choices made in constructing the two isochrones.
Other Images in This Article
Copyright and Terms & Conditions
© 2020. The American Astronomical Society. All rights reserved.
Copyright ©
2026 Astronomy Image Explorer. All Rights Reserved.