Image Details
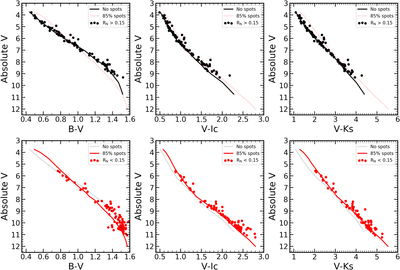
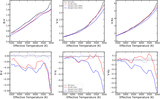
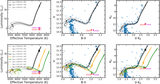
Caption: Figure 8.
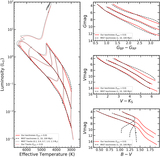
Comparison of colors from the SPOTS models to low-mass stars in the Pleiades as a function of rotation. Top: black and red lines represent the SPOTS models of spotless and fspot = 0.85 at 120 Myr in three different color bands. Black points are Pleiads with a Rossby number greater than 0.15, indicating slower rotating. Agreement with the spotless models is overall very good, but not with the spotted models. Bottom: same as top, except for stars with Rossby number less than 0.15, indicating rapid rotation. In the central and right panels, the fspot = 0.85 model predicts the data better than the spotless model, though it is less clear in the left-most panel.
Other Images in This Article
Copyright and Terms & Conditions
© 2020. The American Astronomical Society. All rights reserved.