Image Details
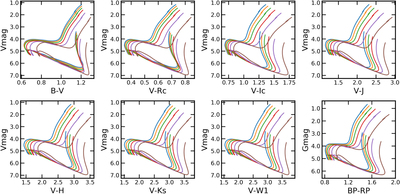
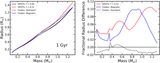
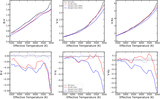
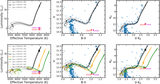
Caption: Figure 3.
Influence of starspots in several different color bands from the SPOTS models. Each track is 1 M⊙, and the different colors reflect the different spot intensities given in the caption of Figure 2. The influence is different in each band, reflecting the fact that different colors sample different portions of the changing S.E.D. of spotted stars.
Other Images in This Article
Copyright and Terms & Conditions
© 2020. The American Astronomical Society. All rights reserved.
Copyright ©
2026 Astronomy Image Explorer. All Rights Reserved.