Image Details
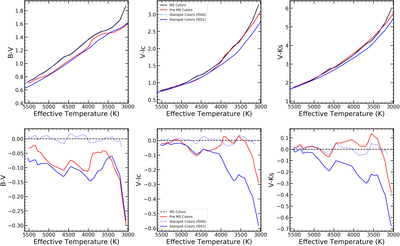
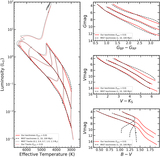
Caption: Figure 9.
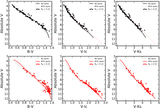
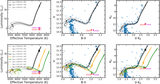
Comparison of colors from the SPOTS models to the pre-MS colors of Pecaut & Mamajek (2013). Top: a comparison of three different colors as a function of Teff. The black and red lines show the MS and pre-MS color calibrations from PM13, respectively. The dotted and solid blue lines are colors from our spotless and fspot = 0.51 models, respectively. The dotted line agrees well with the black line because the PM13 MS colors were the source of our calibration, so our spotless model will simply reproduce that relation. The solid blue line shows the predictions of the spot colors. In the first panel, they show excellent agreement with the pre-MS colors, suggesting that the offset between PMS and MS could be a product of starspots. The agreement is not as good at the cool end of the center panel or at any temperature in the right panel. Bottom: detrending the top panels relative to the MS Colors line. The qualitative agreement at higher temperatures, and the divergence at lower temperatures for V − IC and V − KS, is readily apparent.
Other Images in This Article
Copyright and Terms & Conditions
© 2020. The American Astronomical Society. All rights reserved.