Image Details
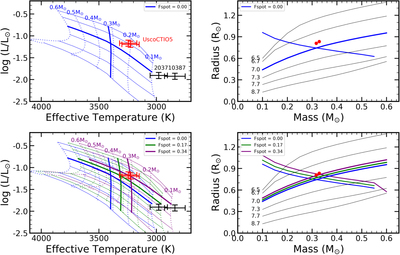
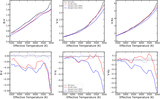
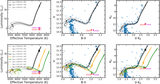
Caption: Figure 6.
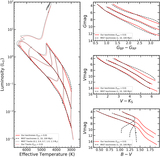
Analysis of the eclipsing binary UScoCITO 5 and EPIC 203710387 (Kraus et al. 2015) with the SPOTS models. Top left: the location of the four members of the two eclipsing binaries in the H-R diagram. The vertical blue line is a 0.32 M⊙ spotless model, equivalent to the mass of the binary components, and the horizontal solid line is an isochrone at 10 Myr, the assumed age of the Upper Sco association. Top right: the location of USco5 in the mass–radius plane. The positive-slope line is the expected mass–radius relation at 10 Myr, and the negative-slope line is the locus predicted by the luminosity of the stars. In both top panels, it is clear that the models do not accurately predict the properties of USco5. Bottom left: same as top left, except models with fspot = 0.17 and 0.34 have been added. The starspots cool the models and reduce the rate of Hayashi contraction such that the fspot = 0.34 models correctly predict the Teff of the components of UscoCTIO 5, and fspot values of 0.2–0.4 predict the Teff of EPIC 203710387 at 10 Myr. Bottom right: same as top right, but models with fspot = 0.17 and 0.34 have been added. The inflated radius induced by magnetic activity causes the mass–radius relation to move upward in this plane, and the locus of constant luminosity also moves upward. The fspot = 0.34 models now accurately predict the properties of USco5 in this plane.
Other Images in This Article
Copyright and Terms & Conditions
© 2020. The American Astronomical Society. All rights reserved.