

Image Details
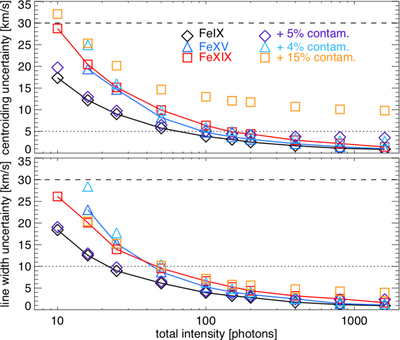
Caption: Figure 6.
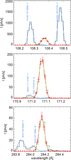
Estimate of uncertainties in centroiding (top panel) and line width (bottom panel) determination in MUSE, from Monte Carlo simulations, for Fe IX 171 Å (black diamonds, solid black line), Fe XV 284 Å (blue triangles, solid blue line) and Fe XIX 108 Å (red squares, solid red line), as a function of total intensity of the line (and therefore signal-to-noise ratio). The lighter colored (purple, light blue, orange, for 171 Å, 284 Å, and 108 Å respectively) symbols represent the corresponding estimates when a contaminant (with intensity relative to the intensity of the main line, as indicated in the inset) is present (we show the maximum value for our sampled velocities; see text for details). Note that the level of contamination (5%, 4%, 15%) quoted is based on the same definition as that of the spectral purity of Figure 5 (i.e., measured within ±2 pixels of the main line center, and spectral purity equal to 100 minus contamination). The dotted lines show the maximum desired uncertainty for the 171 and 284 Å lines (5 and 10 km s−1 for Doppler velocity and line width, respectively), and the dashed lines for the 108 Å line (30 km s−1 for both line shift and width).
Other Images in This Article
Show More
Copyright and Terms & Conditions
© 2019. The American Astronomical Society.

