

Image Details
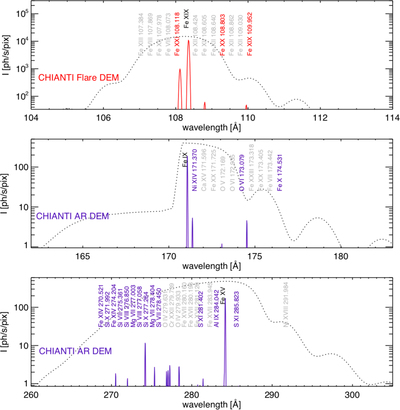
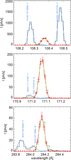
Caption: Figure 1.
The MUSE spectral bands are centered around bright, isolated spectral lines, as shown in these MUSE synthetic spectra (colored solid lines) created by using the CHIANTI flare DEM (top panel, for the 108 Å passband) and active region DEM (middle and bottom panels, for the 171 Å and 284 Å passbands, respectively), convolved with the MUSE effective areas (shown, scaled, as dotted lines). Lines with intensity within three orders of magnitude of the main line are marked by colored labels, while weaker lines are marked by light gray labels.
Other Images in This Article
Show More
Copyright and Terms & Conditions
© 2019. The American Astronomical Society.

Copyright ©
2026 Astronomy Image Explorer. All Rights Reserved.
