

Image Details
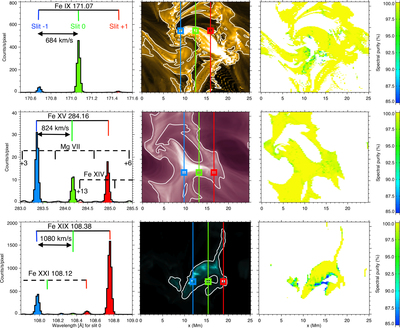
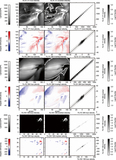
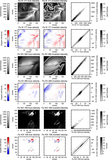
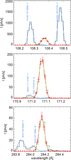
Caption: Figure 5.
The MUSE spectral lines are well isolated for most locations in typical MUSE targets (with S/N > 10, white contours in middle column) as evidenced by maps of spectral purity (right column) for Fe IX 171 Å (top) and for Fe XV 284 Å (middle) using the flux emergence simulation of model B (Hansteen et al. 2019) and Fe XIX 108 Å (bottom) using the flare simulation of model C (Cheung et al. 2019b). Examples of a typical spectrum (left column) show well-isolated main lines and minor contamination from secondary lines. The slit number from which the spectral contribution originates is indicated, e.g., “+13” Fe XIV arises from a slit 13 slits to the right of the central slit 0. The spectral purity (fraction of intensity within ±2 pixels of MUSE detected line that is not from neighboring slits) is close to 100 in most locations.
Other Images in This Article
Show More
Copyright and Terms & Conditions
© 2019. The American Astronomical Society.

