

Image Details
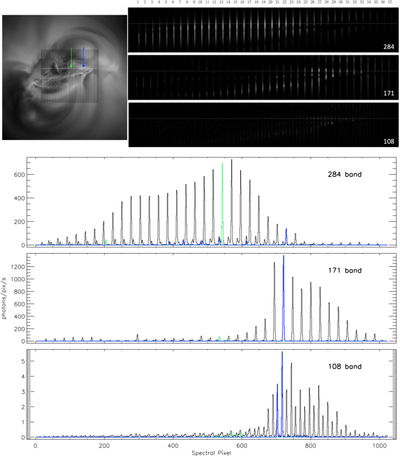
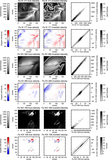
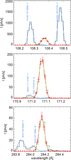
Caption: Figure 3.
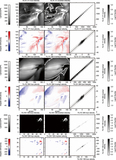
MUSE data products of model A, a quiescent AR simulation (Mok et al. 2008), illustrate that, under typical conditions and in most locations, there is no significant overlap of spectra. The image in the upper left shows a synthetic Fe IX 171 Å image with slits overlaid. The three panels in the upper right show the MUSE observables in all three passbands. The bottom three rows (284, 171, and 108 Å) show MUSE synthetic spectra from a horizontal cut (white line in top-left panel) through the active region. The 284 and 171 Å channels are dominated by Fe XV and Fe IX, respectively. Black lines show the total spectrum, while green and blue lines show the contributions from two individual slits. The simulated active region does not reach high enough temperatures to show significant Fe XIX 108 Å emission. Instead the emission shown in the 108 Å channel is dominated by Fe VIII (see Figure 1), which, however, shows very low counts (on the order of a few counts per second).
Other Images in This Article
Show More
Copyright and Terms & Conditions
© 2019. The American Astronomical Society.

