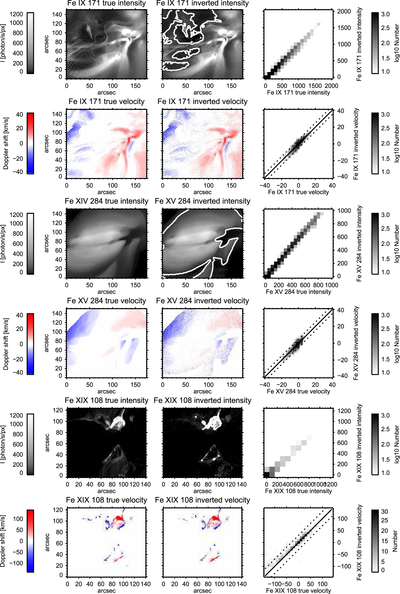
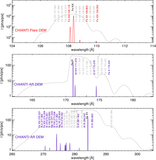
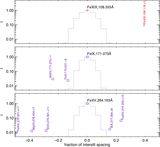
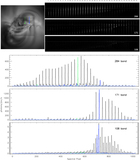
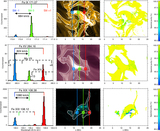
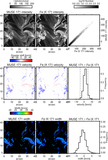
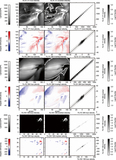
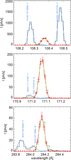
Same as Figure 8 but the response functions used in the inversion have different abundances than the ones used to calculate the MUSE intensities. The only difference between this result and the one shown in Figure 8 is the somewhat broader distribution of intensities in the main lines.