

Image Details
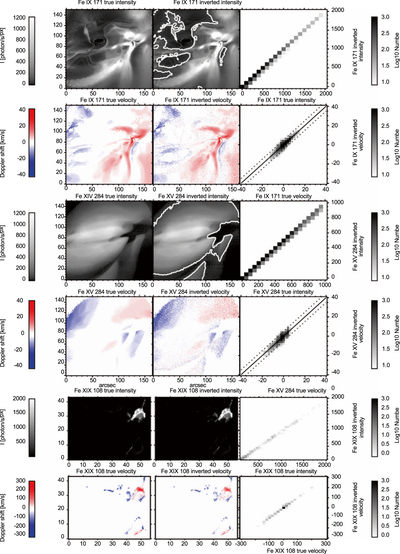
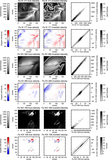
Caption: Figure 8.
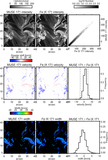
Illustration of our novel Spectral Disambiguation Code (SDC) that successfully resolves multi-slit confusion in the MUSE spectra. Comparison of ground truth (left column) Fe IX 171 Å, Fe XV 284 Å, Fe XIX 108 Å intensities (even rows) and velocities (odd rows) from numerical simulations of an active region (model A, top 4 rows) and a flare (model C, bottom two rows) with intensities and velocities from the SDC inversion (middle column) show very good agreement. Joint probability density plots (right column) compare the true and inverted values; for velocities the plot only shows locations with S/N > 10, illustrated with the contoured intensities. The true signal does not include photon noise, while the SDC inversion is based on inverting MUSE data that includes photon (Poisson) noise for a 1 s and 1.5 s exposure time for the quiescent AR and the flare simulations, respectively. Dotted lines show ±5 km s−1 error bars for 171 and 284 Å.
Other Images in This Article
Show More
Copyright and Terms & Conditions
© 2019. The American Astronomical Society.

