

Image Details
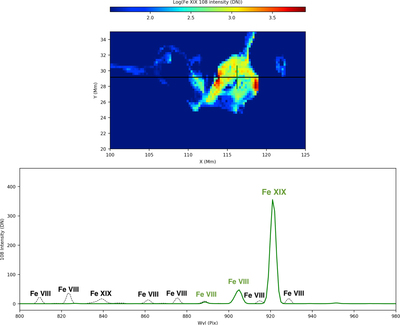
Caption: Figure 4.
Synthetic MUSE spectra from a horizontal cut (bottom panel) through model C, a MURaM simulation of a C-class flare (Cheung et al. 2019b). Top panel shows Fe XIX 108 Å synthetic MUSE image. The bottom panel shows MUSE spectrum in black dotted lines, while the green solid line shows the contribution from one individual slit that shows, from right to left, Fe XIX, Fe XXI, and Fe VIII (see Figures 1 and 2), cleanly separated from spectra of neighboring slits. The numerical domain of this simulation is smaller than the full MUSE FOV. We tiled the simulation in a periodic fashion to cover the full FOV. Note that this represents a worst-case scenario in terms of potential multi-slit ambiguities, since it implies that MUSE would be observing two flares occurring at the same time within its FOV.
Other Images in This Article
Show More
Copyright and Terms & Conditions
© 2019. The American Astronomical Society.

