

Image Details
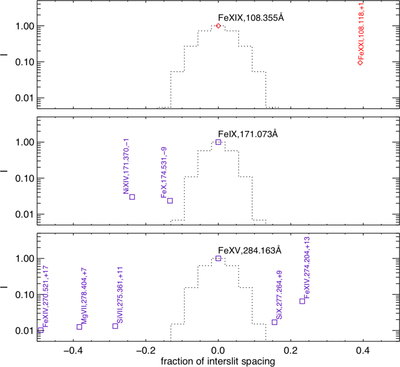
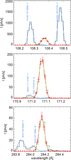
Caption: Figure 2.
The inter-slit spacing in MUSE’s multi-slit design has been chosen to minimize contamination of the main line by spectral lines from neighboring slits. The x-axis of these plots corresponds to the wavelength relative to the main line rest wavelength, normalized to the inter-slit spacing. The y-axis shows the relative strength of spectral lines to the main line, assuming the same DEMs (and convolution with MUSE effective areas) as in Figure 1. Secondary lines are labeled with the slit number (relative to the slit of the main line) from which they originate, e.g., the Fe XIV 274.204+13 label on the bottom panel indicates the location where the Fe XIV 274 Å line from 13 slits to the right falls. The dotted lines show the thermally and instrumentally broadened line profiles for the main lines.
Other Images in This Article
Show More
Copyright and Terms & Conditions
© 2019. The American Astronomical Society.

