Image Details
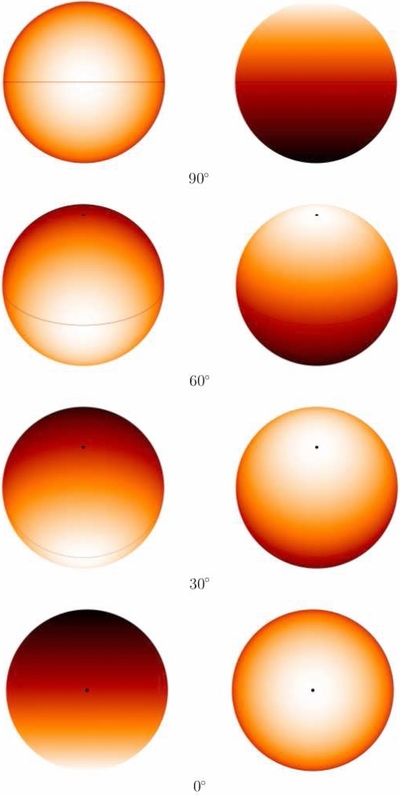
Caption: Figure 6.
Intensity perturbations for l = 1 mode components, at a phase corresponding to extreme displacement of the oscillations. Plotted are patterns for m = 1 (left-hand column) and m = 0 (right-hand column) modes viewed at different angles, i s = 90° (top row), 60° (second row), 30° (third row), and 0° (bottom row). The filled circles mark the pole of the rotation axis and the lines the stellar equator.
Other Images in This Article

Copyright and Terms & Conditions
© 2013. The American Astronomical Society. All rights reserved.
Copyright ©
2025 Astronomy Image Explorer. All Rights Reserved.