Image Details
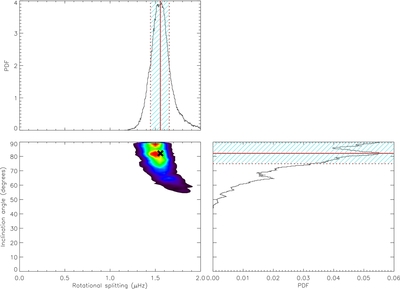
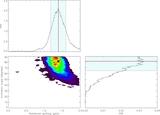
Caption: Figure 9.
Asteroseismic results on Kepler-50. Lower left-hand panel: correlation map in angle of inclination i s and rotational frequency splitting δν s (highest likelihoods rendered in red). Top and right-hand panels: PDFs obtained after marginalization. Note that the PDFs are normalized so that the integral under each curve is unity. Bold crosses mark the final parameter estimates given in Table 4.
Other Images in This Article

Copyright and Terms & Conditions
© 2013. The American Astronomical Society. All rights reserved.
Copyright ©
2025 Astronomy Image Explorer. All Rights Reserved.