Image Details
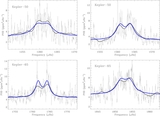
Caption: Figure 1.
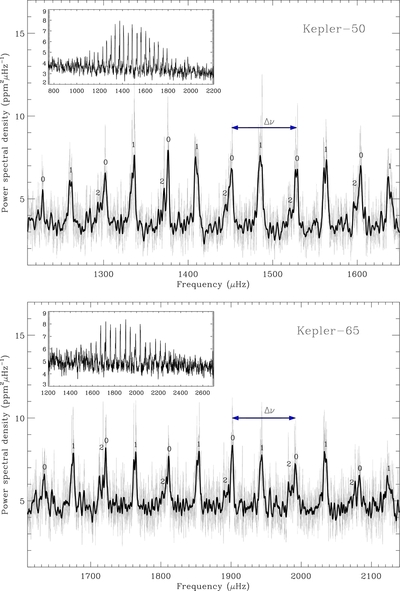
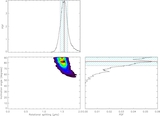
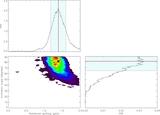
Frequency-power spectra of Kepler-50 (top panel) and Kepler-65 (bottom panel) showing rich spectra of overtones of solar-like oscillations. The main plots in both figures show six overtones, with modes tagged according to their angular degree, l. The so-called large frequency separation between one pair of adjacent l = 0 modes is also marked. The insets show the full frequency extent of both observable p-mode spectra. The Gaussian-like power envelope of each spectrum is readily apparent, which peaks at ν max. Plots rendered in black are the power spectra after smoothing with a 1.5 μHz filter. The light gray curves show the spectra after applying lighter smoothing.
Other Images in This Article
Copyright and Terms & Conditions
© 2013. The American Astronomical Society. All rights reserved.