Image Details
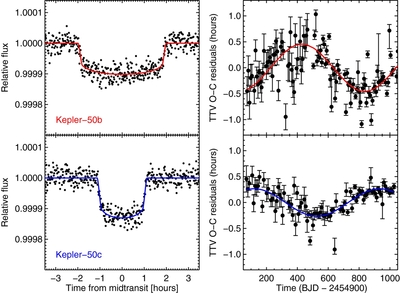
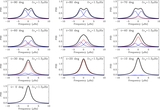
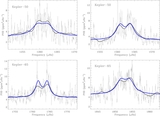
Caption: Figure 4.
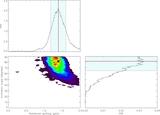
Left-hand panels: the black dots show the binned SC (one-minute cadence) data for each of the Kepler-50 planets, and the lines show the best-fitting transit models. Right-hand panel: TTVs and uncertainties. The sinusoidal anti-correlated signals are plotted with thick lines.
Other Images in This Article

Copyright and Terms & Conditions
© 2013. The American Astronomical Society. All rights reserved.
Copyright ©
2025 Astronomy Image Explorer. All Rights Reserved.