Image Details
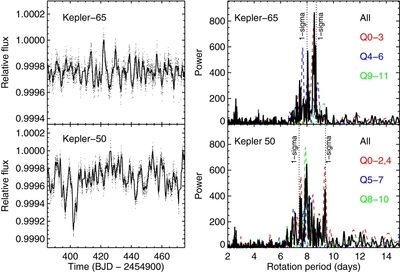
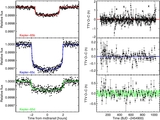
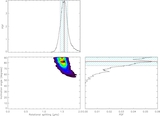
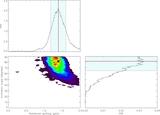
Caption: Figure 11.
Left-hand panels: three-month segments of the long-cadence PDC-MAP data (from Q5), in which intrinsic stellar variability on timescales of days is evident. The dots show the de-trended data (see text), and the thick line represents a smoothed version (10 hr boxcar). Right-hand panels: Lomb–Scargle periodograms of the PDC-MAP data of both stars. Thick black lines: periodograms from using all corrected data. Dashed, colored lines: periodograms of three independent three-quarter-long segments of data. Confidence intervals on the quoted average periods are marked by the vertical dotted lines.
Other Images in This Article

Copyright and Terms & Conditions
© 2013. The American Astronomical Society. All rights reserved.
Copyright ©
2025 Astronomy Image Explorer. All Rights Reserved.