Image Details
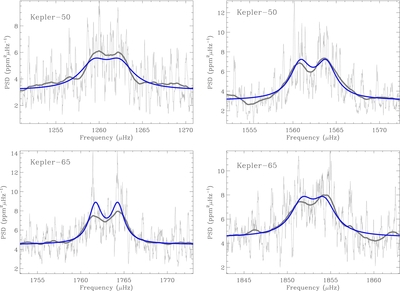
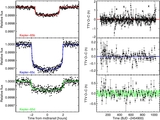
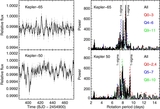
Caption: Figure 8.
Prominent l = 1 modes in the frequency-power spectra of Kepler-50 (top panels) and Kepler-65 (bottom panels). Light gray lines: observed spectra after applying light smoothing. Thick dark gray lines: observed spectra after applying a heavier smoothing of width 1.5 μHz. Dark-blue lines: best-fitting models from MCMC analysis.
Other Images in This Article

Copyright and Terms & Conditions
© 2013. The American Astronomical Society. All rights reserved.
Copyright ©
2025 Astronomy Image Explorer. All Rights Reserved.