

Image Details
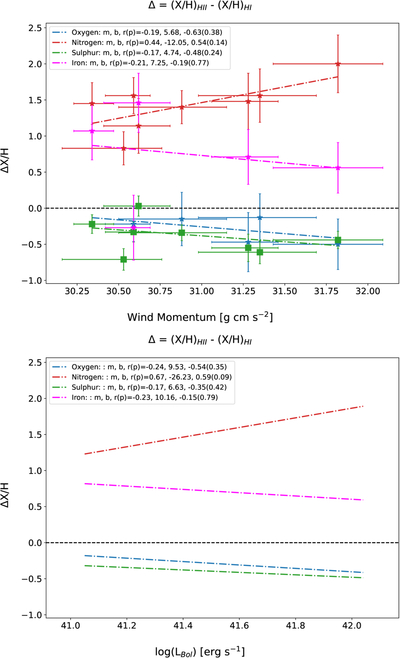
Caption: Figure 20.
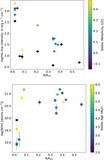
The oxygen (X = O) and nitrogen (X = N) abundance excess relative to solar, ΔX/H = ((X/H)ion–(X/H)neu) plotted as a function of stellar luminosity (Lbol in [erg s−1], bottom) and wind momentum (in [g cm s−2], top) obtained using SB 99 models. Points with high uncertainties in stellar age are also removed. For clarity, we removed the individual data points from the bottom subplot for all YSCs and just show the trend. The statistics for all trends are shown in the legend and follow the same format as Figure 7.
Other Images in This Article
Show More
Copyright and Terms & Conditions
© 2026. The Author(s). Published by the American Astronomical Society.

Copyright ©
2026 Astronomy Image Explorer. All Rights Reserved.
