

Image Details
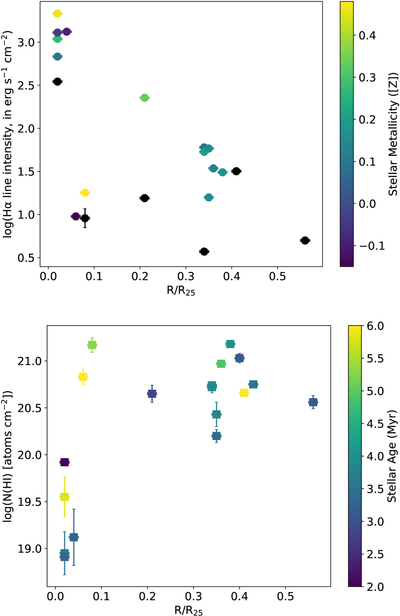
Caption: Figure 6.
Distribution of hydrogen as a function of galactocentric distance (R/R25). Top subplot: For ionized H II region, the Hα intensity is shown (in logscale in erg s−1 cm−2). Bottom subplot: For neutral gas, the H I column density is shown (in logscale in atoms cm−2). The top and bottom subplots are colored with stellar metallicity ([Z]) and stellar ages (in Myr), respectively.
Other Images in This Article
Show More
Copyright and Terms & Conditions
© 2026. The Author(s). Published by the American Astronomical Society.

Copyright ©
2026 Astronomy Image Explorer. All Rights Reserved.
