

Image Details
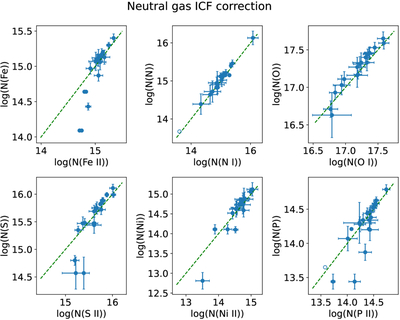
Caption: Figure 4.
Comparing the ICF-corrected elemental column densities (y-axis) to the observed ionic column densities (x-axis). Different subplots show different elements. The 1:1 line is shown in green.
Other Images in This Article
Show More
Copyright and Terms & Conditions
© 2026. The Author(s). Published by the American Astronomical Society.

Copyright ©
2026 Astronomy Image Explorer. All Rights Reserved.
