

Image Details
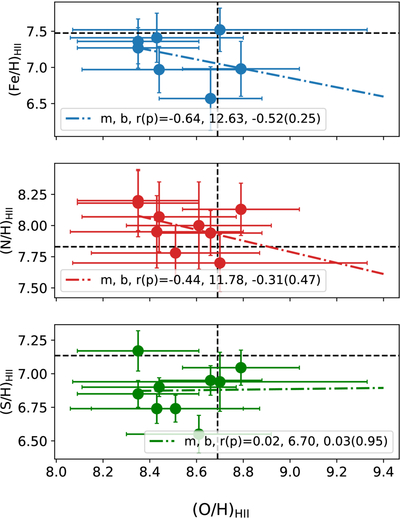
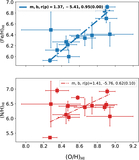
Caption: Figure 7.
Elemental abundances (12+log(X/H)) of X = iron, nitrogen, and sulfur plotted as a function of oxygen in ionized gas (H II region) around YSCs in M83. Only detections are shown here for clarity. The legend for each subplot shows the statistics: fitted line slope, m, intercept, b, Pearson correlation coefficient, r, and significance p-value in brackets. The colored dashed line represents the best line fit, and the horizontal/vertical black dashed line represents solar abundance for each element. The legends appear in boldface, and the best-fit line is thicker if the Pearson correlation is significant, i.e., p-value≲0.05.
Other Images in This Article
Show More
Copyright and Terms & Conditions
© 2026. The Author(s). Published by the American Astronomical Society.

