

Image Details
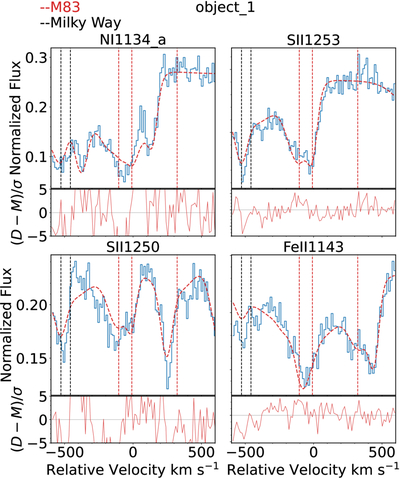
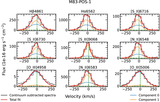
Caption: Figure 3.
Low-ionization metal lines associated with the neutral gas toward the YSC, M83-POS-1 of the M83 galaxy. The normalized HST/COS spectrum is shown in blue with the best-fit multicomponent Voigt profile (M) overplotted in red. Red dashed vertical lines show the location of the different velocity components associated with the neutral gas in M83. Black vertical lines show the location of the different velocity components associated with the neutral gas in the Milky Way for the same species. The residuals ((D–M)/σ) are shown below each subplot in units of the standard deviation (±5σ) obtained from the error spectrum. Each panel represents the total combined fit as a red dashed line, while the vertical lines show the specific positions of the subcomponents of the main ion within the subplot. For, e.g., the NI1134_a subplot represents the total fit for the region around N Iλ1134 with the MW contamination, N I UV absorption triplet, along with contributions from other lines like Fe IIλ1133. Similarly, the FeII1143 subplot shows a combined fit of Fe IIλλλ1142, 1143, 1144.
Other Images in This Article
Show More
Copyright and Terms & Conditions
© 2026. The Author(s). Published by the American Astronomical Society.

