

Image Details
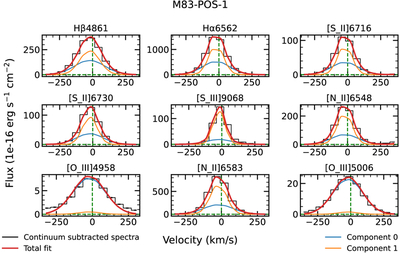
Caption: Figure 5.
Multicomponent Gaussian fit (shown in red) to emission lines (shown in black) observed in the spectra obtained from VLT/MUSE IFU spaxels of the regions surrounding the YSC M83-POS-1. The individual spaxels falling within the HST/COS aperture were summed to obtain the optical spectra seen here. Other colors show contributions from the individual components.
Other Images in This Article
Show More
Copyright and Terms & Conditions
© 2026. The Author(s). Published by the American Astronomical Society.

Copyright ©
2026 Astronomy Image Explorer. All Rights Reserved.
