

Image Details
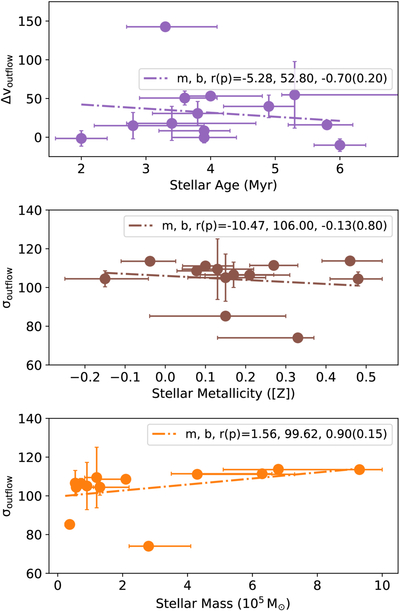
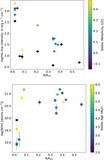
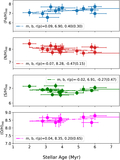
Caption: Figure 9.
Kinematic properties of H II region gas (σoutflow and Δvoutflow; see exact definition in Section 4.2.3) plotted against different stellar properties. The colored dashed lines represent the best line fit for each subplot. Legends are the same as Figure 7.
Other Images in This Article
Show More
Copyright and Terms & Conditions
© 2026. The Author(s). Published by the American Astronomical Society.

Copyright ©
2026 Astronomy Image Explorer. All Rights Reserved.
