

Image Details
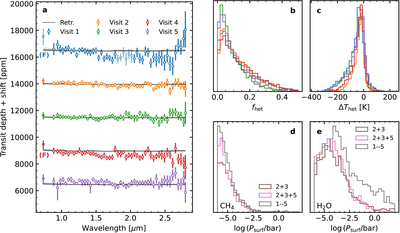
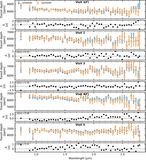
Caption: Figure 2.
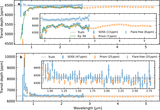
Panel (a): transit spectrum of each of the five TRAPPIST-1 f visits, with vertical offset. Spectra are derived from systematics-corrected light curves. Points from spectral order 1 are represented as empty circles, and spectral order 2 is represented as a filled triangle. Paler points in Visit 1 were ignored due to an asteroid crossing (details in A.1). The “(F)” on the left indicates visits with a flare near ingress. Black curves and the gray shaded regions show the retrieved (median, ±1σ, and ±2σ) N2-dominated atmosphere and TLSE models from the simultaneous fit of Visits 1–5, i.e., five visits fitted with different TLSE parameters but a common planetary radius and quiet photosphere temperature. Panels (b) and (c): posterior distributions of the stellar heterogeneity covering fraction and temperature difference with respect to the quiet photosphere, assuming a haze-free, N2-dominated atmosphere. Each histogram corresponds to a visit, with the same color code as in panel (a). These distributions were obtained from the same simultaneous fit of Visits 1–5 as for the retrieved models in panel (a). Panels (d) and (e): posterior distributions of the (log) surface pressure of pure CH4 (d) and pure H2O (e) haze-free atmospheres when combining Visits 2+3 (brown), 2+3+5 (pink), or 1–5 (gray). Transit spectra and other data products can be found on Zenodo via DOI: 10.5281/zenodo.14501417.
Other Images in This Article
Show More
Copyright and Terms & Conditions
© 2026. The Author(s). Published by the American Astronomical Society.

