

Image Details
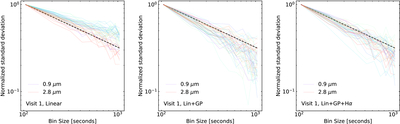
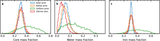
Caption: Figure B5.
Normalized standard deviation of the residuals from the light-curve fits of Visit 1 as a function of bin size. The three panels correspond to three levels of systematics correction: linear function only (left); linear function and GP (middle); and linear function, GP, and Hα detrending (right). Different colors correspond to different wavelength bins, the most violet being the shortest wavelength and the reddest, the longest.
Other Images in This Article
Show More
Copyright and Terms & Conditions
© 2026. The Author(s). Published by the American Astronomical Society.

Copyright ©
2026 Astronomy Image Explorer. All Rights Reserved.
