

Image Details
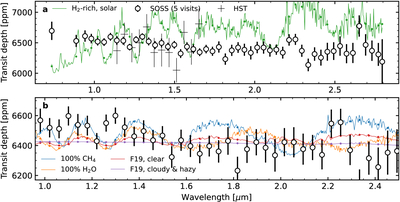
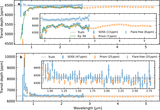
Caption: Figure 3.
Panel (a): error-weighted average of the five TLSE-corrected SOSS transit spectra of TRAPPIST-1 f (black points). The green curve is an H2/He-dominated, 1 bar atmospheric model at solar metallicity. Green points are at the resolution of the data. Crosses are HST data (J. d. Wit et al. 2018; Z. Zhang et al. 2018). Panel (b): same SOSS spectrum as in panel (a), zoomed in, compared to pure, 1 bar atmospheric models (blue and orange), and to the Archean-Earth models from T. J. Fauchez et al. (2019; red and purple). This transit spectrum and other data products can be found on Zenodo via DOI: 10.5281/zenodo.14501417.
Other Images in This Article
Show More
Copyright and Terms & Conditions
© 2026. The Author(s). Published by the American Astronomical Society.

