

Image Details
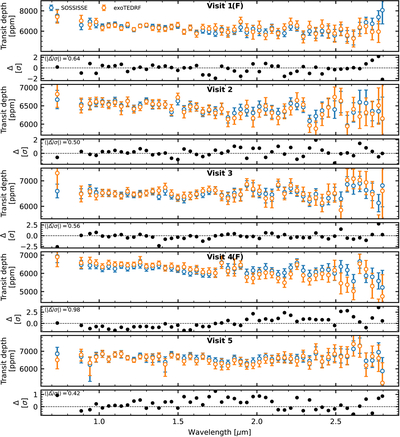
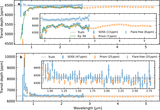
Caption: Figure A1.
Comparison between the transit spectra from SOSSISSE (blue) and from exoTEDRF (orange). exoTEDRF spectra are vertically offset by 154, −19, −7, 81, and −26 ppm for Visits 1–5, respectively. Panels under each transit spectrum (black) show the differences between the two spectra, normalized by the smallest error bar between the two points in each bin. The mean normalized absolute difference is given in the top-left corner of each panel. “(F)” indicates visits with a flare near ingress.
Other Images in This Article
Show More
Copyright and Terms & Conditions
© 2026. The Author(s). Published by the American Astronomical Society.

Copyright ©
2026 Astronomy Image Explorer. All Rights Reserved.
