

Image Details
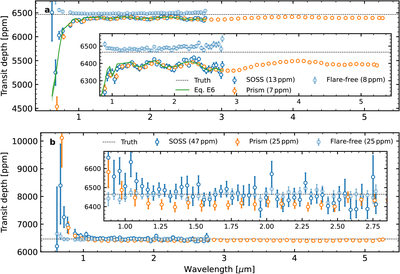
Caption: Figure E2.
Examples of simulated, flare-contaminated transit spectra. (a) Comparison between flare-contaminated transit spectra using NIRISS-SOSS-like (solid blue) and NIRSpec-Prism-like (orange) observational setups. The inset shows the spectra zoomed in. Light curves were fitted with a transit model only to show the “raw” effect of the flare. The green curve and shaded region show the median ±1σ from the fit of Equation (E4). (b) Same as panel (a), but light curves were fitted with a transit model, a linear function, and a simple-harmonic-oscillator (SHO) kernel GP to show the “net” effect of the flare. The inset shows the spectra zoomed in. In both panels, the transparent blue spectrum is a flare-free simulation using the SOSS-like observational setup, the black dotted line is the true (input) squared planet-to-star radius ratio, and numbers in parentheses in the legends give the median transit depth error bar.
Other Images in This Article
Show More
Copyright and Terms & Conditions
© 2026. The Author(s). Published by the American Astronomical Society.

