

Image Details
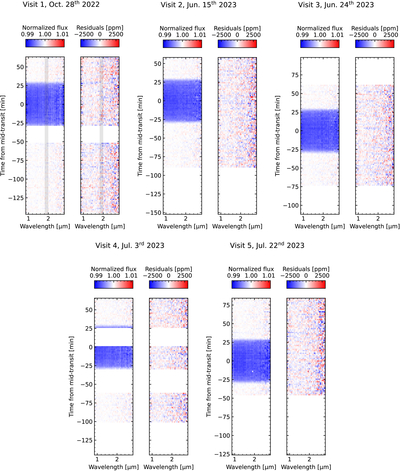
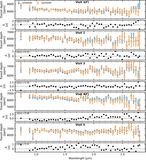
Caption: Figure B6.
Systematics-corrected, spectroscopic light curves (left of each pair of panels) and residuals from the best-fitting transit and systematics model (right of each pair of panels). Panels are displayed from left to right and from top to bottom in chronological order of observation. White spaces represent data that were masked during the light-curve fit. Shaded regions in Visit 1 indicate the wavelengths that the asteroid crossed on the spectral trace.
Other Images in This Article
Show More
Copyright and Terms & Conditions
© 2026. The Author(s). Published by the American Astronomical Society.

Copyright ©
2026 Astronomy Image Explorer. All Rights Reserved.
