

Image Details
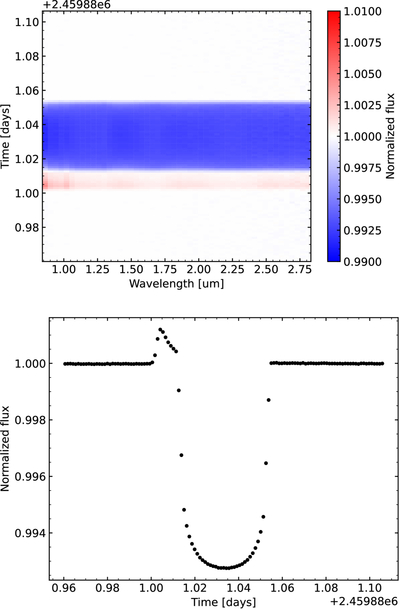
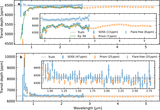
Caption: Figure E1.
Example of flare simulation. Top panel: spectral time series. Bottom: broadband light curve. The flare has an amplitude of 0.001, FWHM of 10 minutes, peak time of 10 minutes prior to ingress, initial temperature difference of 1500 K, and cooling time of 75 minutes.
Other Images in This Article
Show More
Copyright and Terms & Conditions
© 2026. The Author(s). Published by the American Astronomical Society.

Copyright ©
2026 Astronomy Image Explorer. All Rights Reserved.
