

Image Details
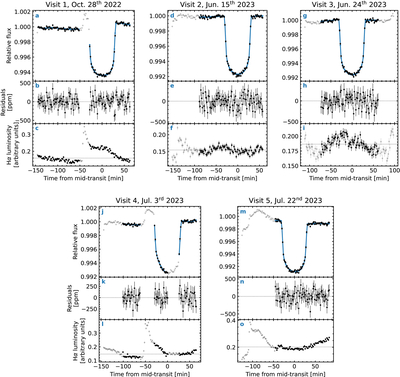
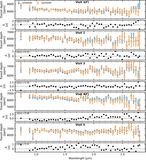
Caption: Figure 1.
The top panel of each subplot shows the broadband light curve (black and gray points) and the best-fit transit and systematics model (blue curve) for the five transits of TRAPPIST-1 f. Gray points are integrations that were masked in the light-curve fit. The in-transit, masked integrations in Visit 4 correspond to a possible spot-crossing event. All other masked integrations are masked due to stellar activity. The middle panels show the residuals from the best-fit model, while the bottom panels show the integrated flux of the Hα stellar line. Gray points correspond to the light-curve points that were masked in the fit. All error bars are 1σ uncertainties.
Other Images in This Article
Show More
Copyright and Terms & Conditions
© 2026. The Author(s). Published by the American Astronomical Society.

